TL;DR:
- A structured real estate market analysis workflow involves tiered screening, verified financial assessment, and rigorous underwriting to avoid poor investment decisions. AI tools accelerate data gathering and improve forecast accuracy, emphasizing the importance of granular neighborhood-level data and comprehensive stress testing. Proper expense normalization and thorough risk evaluation are essential for confident property investment decisions.
A real estate market analysis workflow is defined as a structured, multi-tiered process that organises property evaluation into sequential stages of screening, financial review, and rigorous underwriting. For analysts and investors operating in competitive markets, from the sun-drenched boulevards of Cannes to the prestige addresses of Monaco, this process is the difference between a confident acquisition and a costly mistake. The workflow integrates modern tools such as Claude Projects, established financial metrics including cap rate and debt service coverage ratio (DSCR), and granular submarket data to produce decisions grounded in verified fact rather than aspiration. When executed with discipline, it eliminates poor deals swiftly and reserves your deepest analytical effort for prospects that genuinely merit it. This guide sets out every stage of that process, with the precision and clarity that serious investment demands.
What are the key stages of a real estate market analysis workflow?
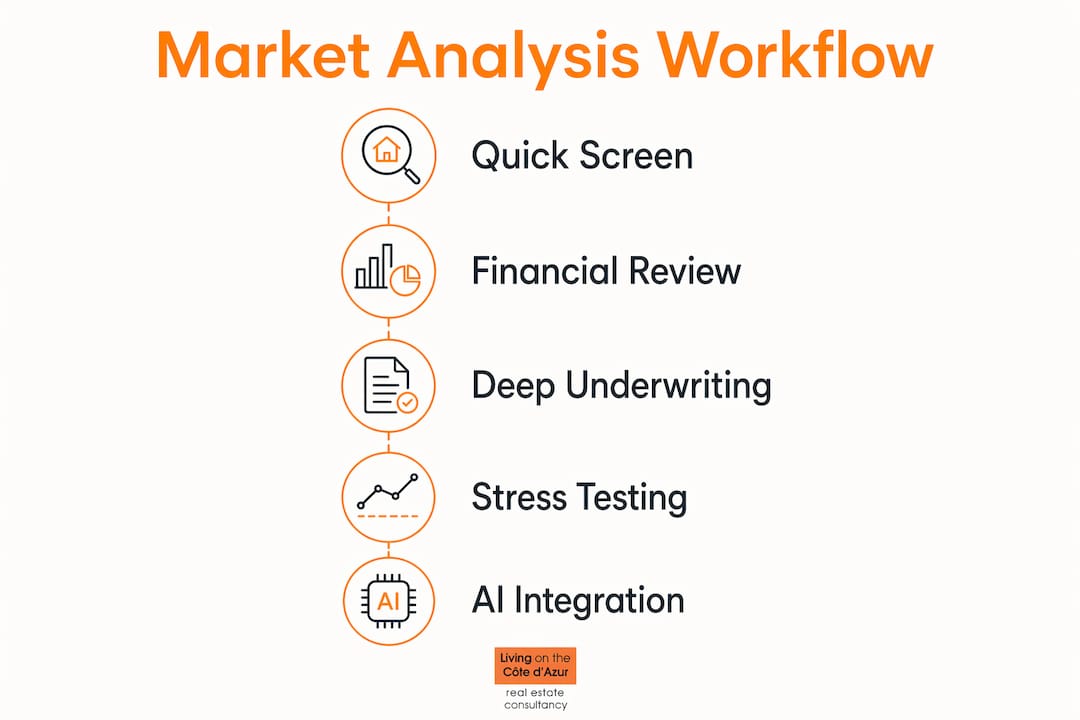
A high-efficiency workflow divides into three tiers: a quick screen lasting 5–10 minutes, a detailed financial analysis taking 30–60 minutes, and a deep-dive underwriting stage requiring 2–4 hours. Each tier has a distinct purpose, and moving a deal forward without completing the prior stage wastes time and distorts judgement.
Tier one: the quick screen
The quick screen exists to protect your calendar. It eliminates roughly 80% of potential deals before you invest meaningful effort, based on a handful of non-negotiable criteria: asking price relative to local comparables, gross rent multiplier, and a surface-level review of location fundamentals. If a property fails two or more of these tests, it moves no further. This discipline prevents the condition professionals call analysis paralysis, where an investor spends days modelling a deal that should have been rejected in minutes.
Tier two: detailed financial analysis

Deals that pass the quick screen enter a 30–60 minute financial review. Here, the real estate analysis process becomes more granular. You verify gross rental income against current market rents, not the seller’s optimistic projections. You normalise operating expenses, accounting for vacancy at realistic local rates, property management, maintenance reserves, and insurance. Cap rate and DSCR calculations follow from these verified figures. A deal that shows a 6% cap rate on seller-stated income may reveal a 4.2% cap rate once expenses are properly normalised. That distinction determines whether the deal proceeds.
Tier three: deep underwriting
Underwriting is where the real estate data workflow reaches its full depth. Over 2–4 hours, you verify property taxes against public records, obtain insurance quotes, commission or review a rehab cost estimate, and model financing structures. Stress testing is built into this stage, not added as an afterthought. You also construct a formal deal memo, and the critical discipline here is building from verified data rather than working backward from a target return. Memos built from asset reality carry far more credibility with partners and lenders than those reverse-engineered from desired yield.
| Stage | Duration | Primary objective | Outcome |
|---|---|---|---|
| Quick screen | 5–10 minutes | Eliminate non-starters | Pass or reject |
| Financial analysis | 30–60 minutes | Verify income and expenses | Adjusted financial model |
| Deep underwriting | 2–4 hours | Stress test and finalise | Investment decision memo |
Pro Tip: Structure your deal memo from the asset outward. Begin with verified rent rolls, actual tax records, and real insurance quotes. Never begin with your target IRR and fill in assumptions to support it. Investors and lenders read the difference immediately.
How does AI enhance the real estate market analysis process?
Artificial intelligence has materially changed the speed and depth of submarket research. AI-assisted workflows reduce submarket analysis time from 20–30 hours to 4–6 hours. That compression does not come at the cost of accuracy. When analysts use three or more complementary data methods, forecast accuracy improves by 41%.
Using persistent AI workspaces
Claude Projects, a persistent AI workspace, allows analysts to upload property documents, local planning reports, and rental market data into a single environment. The AI then synthesises these inputs across sessions, flagging inconsistencies and surfacing patterns that manual review would miss. This is not a replacement for professional judgement. It is a tool that removes the mechanical burden of data aggregation, freeing analysts to focus on interpretation.
The data streams that matter most
Not all data is equally useful. The most valuable streams for a real estate data workflow are those that reflect current and forward conditions, not historical averages. The following data types form the core of a well-constructed submarket analysis:
- Building permits issued (leading indicator: signals future supply pressure 6–12 months ahead)
- Job growth and employer announcements (leading indicator: predicts tenant demand and rent capacity)
- Active rental listings and days on market (current indicator: reveals real-time absorption rates)
- Crime statistics by postcode (current indicator: directly affects tenant quality and vacancy)
- School performance ratings (lagging but stable: drives family tenant demand and long-term values)
- Population migration trends (leading indicator: forecasts medium-term demand trajectory)
- New development pipeline (leading indicator: anticipates future competition for tenants)
Each of these streams tells a different part of the submarket story. Using them together, rather than relying on any single source, is what produces the 41% improvement in forecast accuracy referenced above. The complementary data approach treats each stream as a lens, and the clearest picture emerges when multiple lenses align.
Pro Tip: When selecting data sources, prioritise those that report at the postcode or neighbourhood level. Metro-wide averages mask the micro-conditions that determine whether your specific asset will perform. A city may show 5% rental growth while the submarket you are buying into is flat or declining.
What risk analysis and stress testing techniques are essential?
Stress testing is the practice of modelling how a property performs under adverse conditions before you commit capital. Best practice scenarios include reducing rental income by 10%, doubling the vacancy rate from its current level, and applying a 1–2% interest rate increase to variable financing. A deal that produces positive cash flow under all three of these pressures simultaneously is genuinely resilient. A deal that breaks under any single scenario deserves either renegotiation or rejection.
Common risk factors to evaluate
The following risk factors must be assessed in every underwriting stage:
- Vacancy rate sensitivity — model the asset at current market vacancy, then at double that rate
- Rent reversion risk — assess what happens if rents decline to levels seen two years prior
- Interest rate exposure — test both fixed and variable financing at current rates plus 1% and 2%
- Capital expenditure surprises — include a contingency reserve of at least 5–10% of purchase price
- Management cost normalisation — include professional management fees even if you intend to self-manage, to test true economic viability
- Regulatory and planning risk — assess exposure to rent control changes or zoning amendments
The sixth factor is frequently overlooked by investors focused on financial modelling. In markets such as the Côte d’Azur, where planning regulations and heritage protections are active, regulatory risk can affect both development potential and short-term rental permissions.
Stress test outcome matrix
The table below illustrates how a sample property with a €3,000 monthly gross rent and a €1,800 monthly mortgage payment performs across stress scenarios.
| Scenario | Monthly rent | Vacancy cost | Net cash flow |
|---|---|---|---|
| Base case (5% vacancy) | €3,000 | €150 | +€1,050 |
| Rent down 10% | €2,700 | €150 | +€750 |
| Vacancy doubled (10%) | €3,000 | €300 | +€900 |
| Rate increase +2% (€200 added) | €3,000 | €150 | +€850 |
| Combined stress | €2,700 | €300 | +€400 |
A property that still produces positive cash flow under the combined stress scenario is a candidate worth pursuing. One that turns negative under any single scenario requires a lower acquisition price to justify the risk.
Which leading indicators improve accuracy in real estate market research?
Leading indicators are data points that predict future market conditions rather than describe past ones. New building permits and job growth are the two most powerful leading indicators available to property analysts, signalling supply and demand shifts up to six months before they appear in transaction data. Lagging indicators such as historical sales prices confirm what has already happened. They are useful for context but dangerous as the primary basis for a forward-looking investment thesis.
Why neighbourhood data outperforms metro averages
Metro-level data is the most commonly cited and the least useful for precise investment decisions. Neighbourhood-level data identifies the specific demand drivers affecting rent and occupancy in the streets where your asset sits. A city may report strong average rental growth while a particular postcode experiences declining demand due to a new development pipeline or a deteriorating school catchment area. Anchoring your analysis in granular, bottom-up data is the single most reliable way to avoid overpaying for an asset in a weakening submarket.
The local factors that most heavily influence property values at the neighbourhood level include school quality, crime rates, population trends, and new development plans. These are not soft considerations. They are quantifiable drivers of occupancy, achievable rent, and long-term capital appreciation. A property investment analysis guide that omits them is incomplete.
Pro Tip: Before committing to any submarket, map the school catchment boundaries and cross-reference them with rental listing data. Properties within high-performing school catchments consistently command rental premiums and attract longer tenancies, both of which improve your DSCR and reduce management costs.
For a deeper understanding of how market analysis shapes decisions, the Livingonthecotedazur resource library offers curated perspectives built from years of Riviera acquisition experience.
Practical steps to integrate submarket data layers
Incorporating these data layers systematically requires a repeatable process. Begin each submarket review by pulling permit data from the local planning authority. Cross-reference it with job growth announcements from regional economic development bodies. Layer in rental listing data from platforms covering your target area, and then overlay crime and school data at the postcode level. This sequence moves from macro supply signals down to micro demand conditions, giving you a complete picture before a single financial model is built. Tools like Findo demonstrate how property data platforms can automate parts of this layering process, reducing the manual effort involved in assembling a coherent submarket picture.
Key takeaways
A disciplined real estate market analysis workflow, built on tiered screening, verified financial data, AI-assisted research, and rigorous stress testing, is the most reliable foundation for confident property investment decisions.
| Point | Details |
|---|---|
| Three-tier structure | Divide every analysis into quick screen, financial review, and full underwriting to protect time and focus. |
| AI accelerates research | Tools like Claude Projects compress submarket research from 20–30 hours to 4–6 hours without sacrificing accuracy. |
| Stress test every deal | Model rent reductions, doubled vacancy, and rate increases simultaneously before committing capital. |
| Lead with neighbourhood data | Postcode-level indicators outperform metro averages for predicting actual asset performance. |
| Build memos from the asset | Start with verified data and work outward. Never reverse-engineer assumptions from a target return. |
Why I believe most investors skip the most important step
After years of working with investors across the Côte d’Azur, from first-time buyers in Antibes to seasoned portfolio holders in Saint-Tropez, I have observed one consistent pattern: the step most frequently skipped is proper expense normalisation. Investors accept the seller’s income figures, apply a rough vacancy assumption, and move to financing. They never normalise management fees because they plan to self-manage. They never stress test because the base case looks attractive enough.
This is precisely where deals that look compelling on paper become painful in practice. The moment a tenant vacates, a boiler fails, or a short-term rental regulation changes, the margin that seemed comfortable evaporates. I have seen investors with genuine market instincts make avoidable losses because their workflow lacked the discipline of a proper stress test.
The AI tools available in 2026 have genuinely changed the speed of research. What I find more interesting is that they have also raised the bar for what counts as thorough analysis. When a competitor can produce a submarket report in four hours that previously took a week, the analyst who still relies on metro averages and seller-stated income is operating at a structural disadvantage. The workflow described in this article is not theoretical. It is the process we apply at Livingonthecotedazur when evaluating every acquisition opportunity we present to clients.
The one principle I return to consistently: property investment risks are not eliminated by optimism. They are managed by process. Build the process first, and the confidence follows naturally.
— Ab Kuijer
Discover curated luxury investment opportunities on the Côte d’Azur
The workflow described above is the analytical foundation we bring to every property we present. At Livingonthecotedazur, we apply this tiered process across a curated portfolio of over 100,000 properties in locations of enduring prestige, from the sun-gilded terraces of Saint-Tropez to the discreet villas of Cap d’Ail. Our clients benefit from verified financial data, local submarket intelligence, and access to off-market luxury properties that never reach public listings. If you are ready to apply rigorous market analysis to an acquisition that promises both legacy and yield, explore our top investment options on the Côte d’Azur and speak with our advisors directly.
FAQ
What is a real estate market analysis workflow?
A real estate market analysis workflow is a structured, tiered process that moves from rapid deal screening through financial analysis to full underwriting. It is designed to eliminate poor deals quickly and concentrate analytical effort on viable investment prospects.
How long does a full market analysis take?
A complete workflow takes between 2.5 and 5 hours per deal. The quick screen requires 5–10 minutes, the financial analysis 30–60 minutes, and the underwriting stage 2–4 hours, as confirmed by established deal analysis frameworks.
What financial metrics are used in property valuation methods?
The core property valuation methods rely on cap rate, DSCR, gross rent multiplier, and net operating income. These metrics are calculated from normalised income and expense figures, not from seller-stated projections.
How does AI improve the real estate analysis process?
AI tools such as Claude Projects reduce submarket research time from 20–30 hours to 4–6 hours and improve demand forecast accuracy by 41% when combined with three or more complementary data streams.
Why is stress testing necessary in a market analysis workflow?
Stress testing reveals whether a deal remains cash-flow positive under adverse conditions, including a 10% rent reduction, doubled vacancy, and a 1–2% interest rate increase. Deals that fail any single stress scenario require renegotiation or rejection before capital is committed.
Recommended
 //
//