
For most UK buy-to-let investors, a good short-term cash return sits in the range of 6–10% cash-on-cash; a reasonable long-term total return target is around 8 to 12 percent per year. Those two numbers, drawn from ONS rent and price data, HMRC guidance, and the UK Land Registry, are the benchmarks worth memorising before you read anything else.
Before screening any deal, check these three metrics first:
- Cash-on-cash return: annual pre-tax cash flow divided by your actual cash invested (deposit plus costs). Targets: around 6 to 10 percent.
- Net yield (cap rate): net operating income divided by purchase price, ignoring financing. Targets: roughly 5 to 7 percent for most UK markets.
- Total return: net yield plus expected annual capital appreciation. Targets: approximately 8 to 12 percent over a full cycle.
Key takeaways
| Point | Details |
|---|---|
| Target cash-on-cash band | Aim for about 6 to 10 percent cash-on-cash; below roughly 4 percent on a leveraged deal warrants scrutiny. |
| Net yield benchmark | A net yield of 5–7% is the standard UK screening range for residential buy-to-let. |
| Always run the financed test | Divide net operating income by annual mortgage payments; target a DSCR of 1.20–1.25× or above. |
| Include all acquisition costs | SDLT, legal fees, and survey costs reduce cost-method ROI from day one and must be modelled upfront. |
| Living On The Cote d’Azur | Offers curated access to Riviera luxury properties with full legal, tax, and financing advisory for investors seeking prestige returns. |
Table of Contents
- What is real estate ROI, and how does it differ from rental yield?
- How to calculate ROI step by step
- When should you use yield, and when should you use cash-on-cash?
- UK benchmarks: what do realistic returns look like in 2026?
- Key factors that change what “good” means for you
- How to set a personal ROI target
- Practical levers to improve ROI and red flags to avoid
- Two fully worked examples you can copy into a spreadsheet
- A perspective on ROI from the Côte d’Azur
- Living On The Cote d’Azur: where ROI meets prestige
- Sources
- FAQ
What is real estate ROI, and how does it differ from rental yield?
These terms are used interchangeably in casual conversation, yet they measure different things. Using the wrong one for a financed purchase is one of the most common errors UK investors make.
Return on investment (ROI) measures the profit generated relative to the money you actually put in. It accounts for your financing structure, so two investors buying the same property at the same price can show very different ROI figures depending on how much they borrowed.
Rental yield measures income relative to property value, with no reference to how the purchase was funded. Gross yield ignores all costs; net yield deducts operating expenses but not mortgage payments.
The five metrics you need, defined plainly:
- Gross rental yield: (Annual rent ÷ Purchase price) × 100. Quick market screener; ignores all costs.
- Net rental yield: ((Annual rent − Operating costs) ÷ Purchase price) × 100. Better for comparing assets; still ignores debt.
- Cap rate: Net operating income ÷ Property value. The commercial standard for asset comparison; financing-neutral.
- Cash-on-cash return: Annual pre-tax cash flow ÷ Total cash invested. The most honest measure for a leveraged buyer.
- Total return: Net yield + annual capital appreciation rate. The long-run wealth-building number.
A single property illustrates the gap. A £250,000 flat generating £14,400 rent per year with £4,800 in operating costs produces a gross yield around 5.8 percent, a net yield near 3.8 percent, and a cap rate near 3.8 percent. Buy it with a 25% deposit and annual mortgage payments roughly equal to the example scale, and your cash flow is roughly zero — cash-on-cash close to zero. The asset looks fine on yield; the financed deal barely breaks even. Investopedia’s ROI methods guide makes exactly this point: leveraged calculations routinely display higher percentage returns than unlevered cost methods, but only when the spread between yield and mortgage rate is positive.
How to calculate ROI step by step
Three calculation methods matter for UK residential investors. Each answers a slightly different question.
The cost method (unlevered ROI)
This treats the full purchase price as your investment, regardless of how much you borrowed.
- Calculate annual net operating income: gross rent minus void allowance, management fees, insurance, maintenance, and ground rent/service charges.
- Add expected annual capital appreciation (use Land Registry regional data as your assumption).
- Divide total annual return by total acquisition cost (purchase price plus Stamp Duty Land Tax, legal fees, survey, and any refurbishment).
- Multiply by 100 for a percentage.
Formula: Cost-method ROI = ((Net income + Appreciation) ÷ Total acquisition cost) × 100
The out-of-pocket method (leveraged ROI)
This uses only your actual cash outlay, making leverage visible. Investopedia notes that this method typically shows higher returns than the cost method when borrowing rates sit below yield.
Formula: Out-of-pocket ROI = ((Net income + Appreciation) ÷ Cash invested) × 100
Cash-on-cash return (the financed test)
This is the most practical metric for a mortgaged buy-to-let because it includes debt service.
Formula: Cash-on-cash = (Annual pre-tax cash flow after mortgage payments ÷ Total cash invested) × 100
Worked example — mortgaged buy-to-let:
- Purchase price: £220,000
- Deposit (25%): £55,000
- SDLT and purchase costs: £9,500
- Total cash in: £64,500
- Mortgage (75% LTV at 5.2% interest-only): £8,580/year
- Gross rent: £13,200/year
- Operating costs (management 10%, insurance, maintenance, voids): £3,960/year
- Net cash flow after mortgage: £13,200 − £3,960 − £8,580 = £660/year
- Cash-on-cash return approximately 1 percent
That number is sobering. Add 3% annual appreciation on £220,000 (£6,600) and total return rises to roughly 11.3% on cash invested — but only if appreciation materialises.
Worked example — renovation flip (all-cash):
- Purchase price: £180,000
- Renovation budget: £28,000
- Holding costs (6 months, council tax, utilities, insurance): £3,200
- Total cost: £211,200
- Sale price: £255,000
- Net profit: £43,800
- Cost-method ROI approximately 21 percent over six months
Pro Tip: Always include SDLT in your total acquisition cost. On a £220,000 buy-to-let purchase, the additional-dwelling surcharge can add several thousand pounds to your upfront spend, meaningfully reducing your cost-method ROI from the first day of ownership. Check current rates on Gov.UK before modelling any deal.
When should you use yield, and when should you use cash-on-cash?
Yield and cap rate are excellent screening tools. Cash-on-cash and ROI are the decision tools. Conflating them leads to buying assets that look attractive on paper but drain cash in practice.
| Metric | What it includes | What it omits | Best used for |
|---|---|---|---|
| Gross yield | Rent, purchase price | All costs, debt | Quick market comparison |
| Net yield / cap rate | Rent, operating costs | Debt service, taxes | Asset-level comparison |
| Cash-on-cash | Rent, costs, mortgage | Appreciation, tax | Financed purchase decision |
| Total return | Income + appreciation | Tax, transaction costs | Long-run wealth modelling |
The financed test is the critical step most amateur investors skip. Compute your net operating income, then divide it by your annual mortgage payment. That ratio is your Debt Service Coverage Ratio (DSCR). Lenders commonly require a DSCR of around 1.20–1.25× for investment lending; anything below 1.0× means the rent does not cover the mortgage, regardless of how attractive the gross yield appears.
A property yielding 5.5% gross in a city where mortgage rates sit at 5.2% may pass a casual yield check yet fail the financed test entirely once operating costs are deducted.
UK benchmarks: what do realistic returns look like in 2026?
The NatWest buy-to-let guide places a “good” gross rental yield for UK residential property in a band around 5 to 7 percent, with figures above 7 percent considered strong in most markets. Net yield, after management fees, maintenance, insurance, and voids, typically runs 1.5–2.5 percentage points below gross.
ONS private rent and house price data confirms that rent growth and price appreciation diverge sharply by region, which means a single national benchmark is a starting point, not a verdict. Northern cities such as Manchester, Liverpool, and Leeds have historically offered higher gross yields than prime London, where capital appreciation has traditionally compensated for thinner income returns.
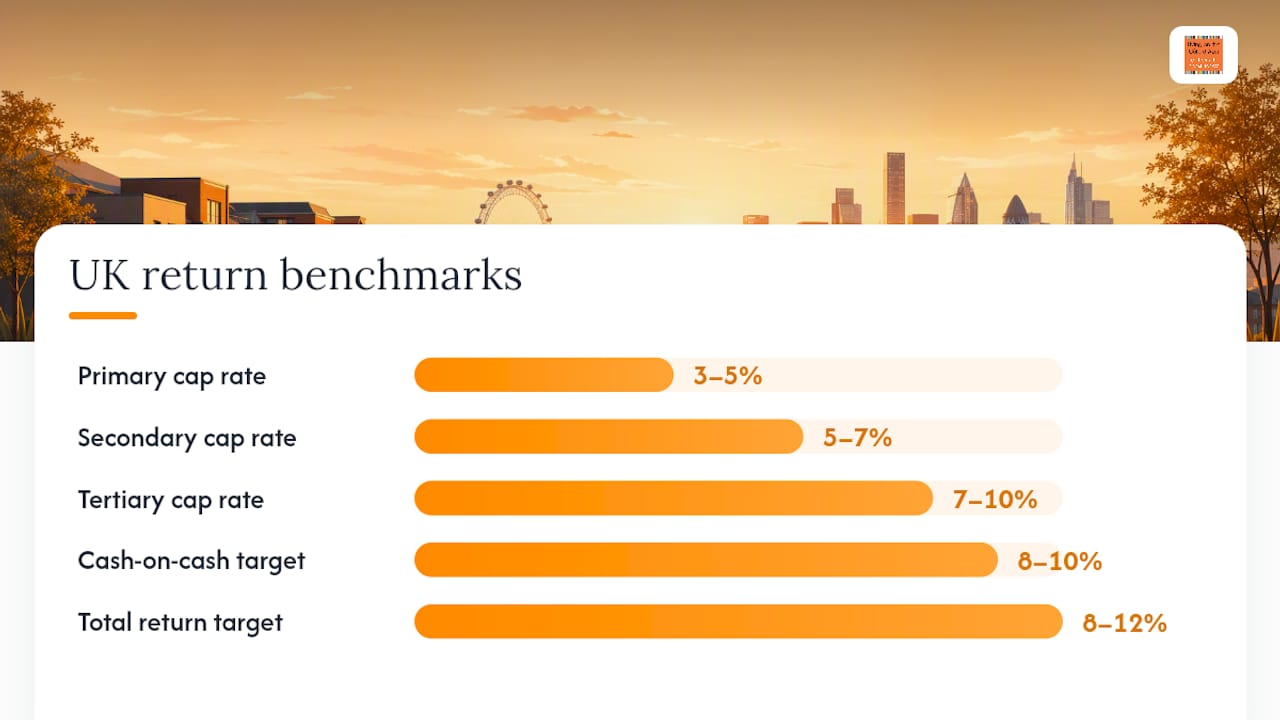
Practical investor guidance places cash-on-cash targets of 8–10% as a useful screening band, with total return targets of roughly 8–12% per year as common long-term benchmarks. Cap rates vary by market tier: primary metros often show cap rates between 3 and 5 percent, secondary markets around 5 to 7 percent, and tertiary markets 7 to 10 percent or above (https://usetruecap.com/blog/what-is-a-good-rental-yield).
The UK House Price Index provides the historical series most analysts use when building appreciation assumptions into total-return models. Over long periods, UK residential property has delivered positive real returns, though individual cycles vary considerably.
What “good” looks like by investor type:
- Conservative income investor: net yield around 4 to 5 percent, cash-on-cash approximately 4 to 6 percent, DSCR above 1.25×.
- Balanced buy-to-let investor: gross yield around 6 to 7 percent, cash-on-cash approximately 6 to 8 percent, total return near 8 to 10 percent.
- Growth-oriented or opportunistic: gross yield over 7 percent, cash-on-cash around 8 to 10 percent or more, total return approximately 10 to 12 percent or higher.
Prime coastal and resort markets, including luxury Riviera locations, often show lower income yields but command a premium for capital preservation and lifestyle value — a distinction we explore in the perspective section below.
Key factors that change what “good” means for you
No benchmark survives contact with a specific deal without adjustment. These are the levers that move your actual return away from the headline figure:
- Mortgage rate and LTV: a 1% rise in your borrowing rate on a 75% LTV mortgage can reduce annual cash flow by thousands of pounds on a mid-range property.
- Void periods: even a modest vacancy assumption of 5–8% of annual rent materially reduces cash-on-cash.
- Management fees: professional letting agents typically charge 8–12% of rent; self-managing saves cost but adds time.
- Maintenance and capital expenditure: a prudent reserve of 1–2% of property value per year is standard practice for older stock.
- Tax treatment: HMRC guidance sets out allowable deductions for landlords; mortgage interest relief is now restricted to the basic rate for most individual landlords, which significantly affects higher-rate taxpayers. Capital Gains Tax applies on disposal, and rates for residential property differ from other assets.
- SDLT surcharge: the additional-dwelling surcharge on second properties adds to acquisition cost and reduces cost-method ROI from day one.
- Investment horizon: a five-year hold demands stronger income returns to compensate for transaction costs; a fifteen-year hold can tolerate thinner early yields if appreciation is credible.
A longer horizon also changes the acceptable ROI threshold. Short holds require the income to do most of the work; long holds allow appreciation to compound and absorb early-year cash flow weakness.
How to set a personal ROI target
Rules of thumb give you a fast filter. They are not substitutes for a full cash-flow model, but they help you discard weak deals in seconds.
Common rules of thumb explained:
- The 1% rule: monthly rent should equal at least 1% of the purchase price (e.g. £1,800/month on a £180,000 property). Useful in high-yield markets; rarely achievable in prime London or coastal resort locations.
- The 2% rule: a stricter version requiring 2% monthly rent-to-price. Largely theoretical in most UK markets today, though occasionally applicable in lower-value northern cities.
- The 50% rule: assume operating expenses (excluding mortgage) will consume roughly 50% of gross rent. A conservative shortcut for quick screening.
A practical decision checklist for any deal:
- Does the gross yield exceed 5%? If not, what is the appreciation case?
- Does the deal pass the financed test at current mortgage rates (DSCR above 1.20×)?
- Are rent estimates supported by comparable lettings in the same street or postcode?
- What is the realistic void rate for this property type and location?
- What is the capital expenditure backlog (roof, boiler, windows, EPC rating)?
- What is your exit strategy, and what transaction costs will you face at sale?
For a structured market analysis workflow, running these checks in sequence before any offer prevents the most costly mistakes.
Target bands by investor profile:
- Conservative: cash-on-cash 4–6%, total return 7–9%.
- Balanced: cash-on-cash 6–8%, total return 9–11%.
- Opportunistic: cash-on-cash 8–10%+, total return 11–13%+.
Practical levers to improve ROI and red flags to avoid
The difference between a mediocre deal and a good one often comes down to cost discipline and honest rent assessment rather than finding a hidden gem.
Levers to improve your return:
- Improve the EPC rating: an upgrade from band D to band C can justify a rent increase and reduce void risk as tenant demand for energy-efficient homes grows.
- Add a bedroom or permitted development extension where planning allows; the uplift in both rent and capital value can be substantial relative to cost.
- Review service charges and ground rent on leasehold properties; these are often negotiable or challengeable.
- Structure ownership appropriately: tax planning for real estate investors can materially affect net returns, particularly for higher-rate taxpayers considering corporate structures.
- Reduce management costs by consolidating a portfolio with a single agent for volume discounts.
Red flags that invalidate a headline number:
- Rent estimates based on asking prices rather than achieved comparable lettings.
- High capital expenditure backlog not reflected in the purchase price.
- Fragile tenant demand: a single employer, a declining high street, or a university town with falling enrolment.
- A deal that only works at today’s mortgage rate with no margin for a 1–2% rate increase.
- Leasehold with fewer than 80 years remaining; mortgage availability and resale value both deteriorate sharply below this threshold.
Pro Tip: Run the financed test at your current mortgage rate and then again at that rate plus 2%. If the DSCR falls below 1.0× at the stressed rate, the deal’s margin of safety is too thin. Most lender guidance on DSCR targets 1.20–1.25× at the actual rate; stress-testing adds a further layer of protection against rate cycles.
Two fully worked examples you can copy into a spreadsheet
Example A: mortgaged buy-to-let
Example B: renovation flip (short bridge loan)
Example B illustrates that a well-executed flip can deliver strong returns in a short period, though the risk profile is entirely different: execution risk, planning risk, and market timing all bear on the outcome.
A perspective on ROI from the Côte d’Azur
When we assess investment potential for clients considering luxury real estate on the French Riviera, the framework differs from a standard UK buy-to-let analysis in one fundamental respect: the income yield is rarely the primary driver. Prime Riviera properties in locations such as Saint-Tropez, Cap d’Antibes, or Monaco are acquired for capital preservation, legacy planning, and lifestyle value as much as for annual income.

That said, the discipline of running a proper ROI calculation applies equally here. We still model net operating income, holding costs, tax treatment under French law, and realistic appreciation assumptions before advising a client. The high-net-worth real estate framework simply weights legacy and lifestyle objectives alongside yield, rather than treating yield as the sole criterion.
The contrast is instructive for UK investors, too. A deal that looks thin on cash-on-cash may still be a sound long-term decision if the location carries genuine scarcity value and the investor’s horizon is fifteen years or more. The numbers must still work; they simply work differently.
Living On The Cote d’Azur: where ROI meets prestige
For investors whose ambitions extend beyond the UK buy-to-let market, Living On The Cote d’Azur offers access to over 100,000 properties across the most coveted addresses on the French Riviera, from Cannes and Antibes to Saint-Tropez and Monaco. Unlike a standard search portal, we bring full legal audit, tax optimisation, and financing advisory into a single, curated process, so you are never left reconciling conflicting advice from separate advisers.
The distinction matters most when the numbers are large. A prestige coastal acquisition involves French inheritance structures, SCI considerations, and capital gains treatment that a UK-only adviser will not navigate fluently. Our team does. Whether you are acquiring a second home, a legacy asset, or a Côte d’Azur investment property with genuine off-market exclusivity, the conversation starts with your ROI objectives and ends with a property that meets them. Contact us to begin your property search.
Sources
These are the primary UK sources for validating the figures and guidance in this article. All are free to access and authoritative for UK residential property investment.
- ONS private rent and house prices bulletin (July 2025)
- UK House Price Index (Land Registry)
- Gov
- How to calculate ROI on real estate investments (Investopedia) — 2025‑06‑01
All figures and thresholds in this article apply to the UK market. Tax rates, SDLT bands, and HMRC rules are subject to change; always confirm current figures with the primary source or a qualified adviser before committing to a purchase.
This article is general information, not a substitute for advice from a qualified financial advisor. Consult a qualified financial professional about your own circumstances before acting on anything here.
FAQ
Is a 20% return on investment good for property?
What is the 2% rule in property?
It is rarely achievable in most UK markets today and is more relevant as a theoretical upper benchmark than a practical screening tool.
Is 7% a good rental yield?
Is a 7% real return realistic over the long term?
Recommended
 //
//